

Open the Google Ads dashboard of almost any Indian D2C brand and you will find a number someone is proud of. ROAS 3.2x. Revenue up. Cost per click in single digits. It looks like the easiest money in marketing.
Then the finance team subtracts the product cost, the shipping, the packaging, the payment gateway fee and the orders that came back, and the 3.2x turns into a profit of a few paise on every rupee of ad spend. Some months it turns into a loss that nobody notices, because the dashboard never shows it.
That gap is why ecommerce SEO vs PPC is one of the most badly argued comparisons in marketing. PPC is judged on ROAS, which flatters it. SEO is judged on traffic, which undersells it. Neither number is profit, and profit is the only basis on which the two channels can be fairly compared.
This article does the comparison in contribution profit. It gives you the break-even ROAS formula and a table of what it looks like by category margin, a 24-month rupee model for a mid-sized Indian D2C store with every assumption stated, the three separate milestones that tell you when organic actually pays for itself, and a step-by-step method to rerun the whole thing on your own store's numbers. It also names the cases where paid is the right answer and stays that way.
If you are after the general channel question for lead-generation businesses rather than stores, we have covered that separately in PPC vs SEO cost for India and in which to invest in first. Ecommerce needs its own version, for reasons the next section explains.
The Short Answer
For an Indian ecommerce store, PPC is the faster channel and SEO is the more profitable one, and the gap between those two statements is roughly sixteen months.
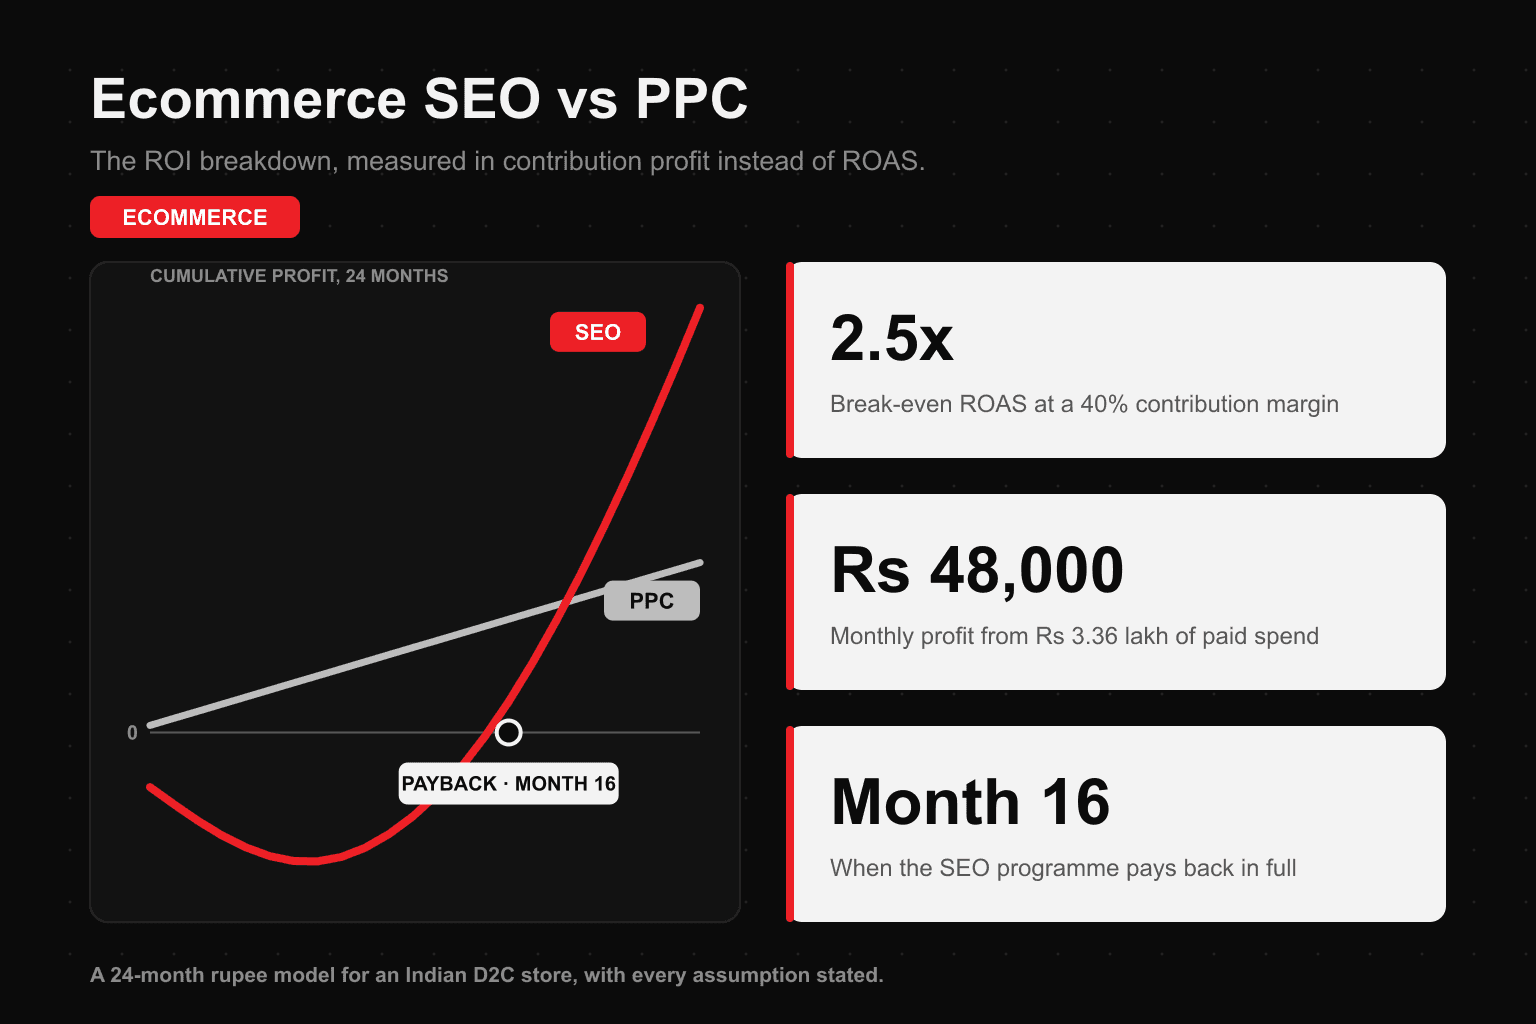
In the model below, a store with a ₹1,500 average order value and a 40 percent contribution margin spends ₹3.36 lakh a month on paid search, all-in, and earns about ₹48,000 a month of contribution profit from it, every month, from month one. The same store spends ₹1.2 lakh a month on SEO plus ₹2.5 lakh once for technical fixes. Organic loses money for eight months, sinks to ₹8.7 lakh underwater, breaks even month-on-month in month 9, recovers everything it cost by month 16, and overtakes paid's cumulative profit in month 19. Over 24 months, paid returns about ₹11.5 lakh of profit and organic about ₹28.8 lakh.
The practical answer for most stores is not a choice. Use paid to buy revenue and search-term data now, use that data to decide which category pages SEO should build, and shift budget toward organic as it crosses each milestone. The exceptions, where paid should keep most of the budget indefinitely, are covered in where each channel wins.
Not sure what your own break-even ROAS is? Most stores we look at have never calculated it, and a surprising number are running non-brand campaigns below it. Our ecommerce PPC team will work out your contribution margin and flag which campaigns are losing money on the first order.
Why Ecommerce Breaks the Standard SEO vs PPC Comparison
Most SEO vs PPC articles are written for businesses that sell services and count leads. Ecommerce differs in five ways, and each one changes the answer.
The unit is an order, not a lead. A lead has a notional value. An order has a real selling price, a real product cost and a real chance of coming back as a return. That means ecommerce can measure channel profit precisely, and it should, instead of stopping at cost per acquisition.
Clicks are cheap, so paid looks deceptively efficient. Ecommerce and retail sit at the bottom of the Indian auction, at roughly ₹3 to ₹20 per click against ₹300 or more in insurance and education, according to our Google Ads CPC benchmarks for India. Cheap clicks do not mean cheap profit. They mean the entire battle is fought on margin and conversion rate rather than on bid price.
Paid listings sit on top of organic ones. On most transactional product searches, a row of Google Shopping ads and sponsored carousels appears above the first organic result. A store can rank first and still sit below the fold, which we unpacked in the ecommerce SERP squeeze. SEO and paid do not compete for the same real estate on every query, and that matters for where each rupee goes.
Marketplaces own many first pages. Amazon, Flipkart, Myntra, Nykaa and a handful of aggregators hold the organic results for a large share of generic product queries. For some categories, the realistic organic ceiling for a brand's own site is the long tail and the category-plus-attribute queries, not the head term.
Customers come back. A service lead is usually a single transaction. An ecommerce customer who buys once and returns twice changes the economics of whatever channel acquired them. A paid campaign that loses money on the first order can still be a good investment if repeat purchase covers it, and ignoring that makes paid look worse than it is.
ROAS Is Not ROI: The Three Numbers That Decide It
Before comparing channels, get three numbers straight. Most of the bad decisions we see come from treating the first one as if it were the third.
ROAS is revenue divided by ad spend. It is the number Google Ads and Meta report by default. It tells you nothing about profit, because it ignores every cost of making the sale except the click. It also cannot describe SEO at all, because SEO has no ad spend to divide by.
Contribution margin is what is left of each rupee of revenue after product cost, shipping, packaging, payment gateway fees and the cost of returns and RTO. It is the profit an order contributes before marketing. For a typical Indian D2C brand it sits somewhere between 15 and 60 percent, depending almost entirely on category.
Break-even ROAS is the ROAS at which an order exactly pays for its own advertising. The formula is one line:
Break-even ROAS = 1 ÷ contribution margin
A store keeping 40 percent of every rupee needs 2.5x ROAS to break even. Anything below 2.5x loses money on the first order. Anything above it makes money. The distance above the line is the real return, and it can be expressed as POAS, profit on ad spend, which is contribution profit divided by total ad cost.
The same 3.2x campaign result is comfortably profitable for a skincare brand, marginal for a home-goods store, and quietly loss-making for a fashion label once returns are counted. A single "good ROAS" benchmark cannot exist for ecommerce, which is also why the 3x to 4x figure you see quoted everywhere, including in our own performance marketing metrics guide, always comes with the caveat to calculate break-even first.
Here is the same idea as a working table.
| Contribution margin | Break-even ROAS | Typical Indian categories | What a 3.2x campaign does |
|---|---|---|---|
| 15% | 6.7x | Electronics, appliances, mobile accessories | Loses about 52 paise per rupee of ad spend |
| 25% | 4.0x | Fashion and footwear after returns and RTO | Loses about 20 paise per rupee |
| 35% | 2.9x | Home, kitchen, decor | Makes about 12 paise per rupee |
| 40% | 2.5x | Mid-margin D2C, the model store below | Makes about 28 paise per rupee |
| 50% | 2.0x | Beauty, skincare, personal care | Makes about 60 paise per rupee |
| 60% | 1.7x | Supplements, wellness, own-brand consumables | Makes about 92 paise per rupee |
The last column is POAS minus one: contribution profit per rupee of media, before agency fees. It is the column your dashboard does not show you.
What Ecommerce PPC Really Returns
Take the model store: an Indian D2C brand with a ₹1,500 average order value and a 40 percent contribution margin, so each order contributes ₹600 before marketing.
It spends ₹3,00,000 a month on media across Shopping, Search and Performance Max, and pays a ₹36,000 management fee, for ₹3,36,000 all-in. At a 3.2x platform ROAS, the media buys ₹9,60,000 of revenue, which is 640 orders.
| Line | Monthly figure |
|---|---|
| Media spend | ₹3,00,000 |
| Management fee (12%) | ₹36,000 |
| Total paid cost | ₹3,36,000 |
| Revenue at 3.2x ROAS | ₹9,60,000 |
| Orders at ₹1,500 AOV | 640 |
| Contribution at 40% | ₹3,84,000 |
| Contribution profit | ₹48,000 |
| Effective ROAS including fee | 2.86x |
| POAS | 1.14 |
Two things are worth noticing.
First, the fee alone moves the store from a platform ROAS of 3.2x to an effective 2.86x, uncomfortably close to its 2.5x break-even line. Almost every ecommerce ROAS figure you have been shown excludes the fee, and many exclude creative production and feed management too.
Second, ₹48,000 of profit on ₹3.36 lakh of cost is a POAS of 1.14. It is real, it arrives from month one, and it is thin. It also does not scale the way the dashboard suggests.
The diminishing-returns problem
The first ₹3 lakh a month buys the cheapest, highest-intent clicks in the account. Every rupee beyond that goes further down the auction into broader queries, less qualified shoppers and more expensive placements. Marginal ROAS, the return on the next rupee rather than the average rupee, falls as spend rises.
| Monthly media | Blended ROAS | Marginal ROAS on the added spend | Monthly profit after 12% fee |
|---|---|---|---|
| ₹3,00,000 | 3.2x | n/a | ₹48,000 |
| ₹5,00,000 | 2.9x | about 2.45x | ₹20,000 |
| ₹8,00,000 | 2.5x | about 1.83x | Minus ₹96,000 |
These scaling figures are illustrative, but the shape is what we see in most Indian D2C accounts: doubling spend rarely doubles profit, and past a certain point it turns profit negative while revenue keeps rising. That is the ceiling on paid, and it is why "just scale the ads" stops working. Bidding strategy helps at the margin, which we covered in when to use tCPA, tROAS or Max Conversions, but it does not change the underlying curve.
What paid gets right that SEO cannot
Paid returns data within days. The search terms report tells you exactly which queries produce orders, at what value, on which products. That data is worth more than the ₹48,000, because it tells the SEO programme which category pages to build first. More on that in how the two channels feed each other.
What Ecommerce SEO Really Returns
Ecommerce SEO has no ad spend, so ROAS cannot describe it. Its cost is a retainer, content, tooling and developer time. Its return is orders from non-paid search, which have the same ₹600 contribution each as a paid order, minus zero media cost.
For the model store, the organic programme costs ₹1,20,000 a month plus a one-time ₹2,50,000 in month one for the technical work that ecommerce sites almost always need first: faceted navigation that wastes crawl budget, thin category pages, duplicate product URLs from variants, missing product schema and a slow mobile product listing page. Our ecommerce SEO checklist covers the full list.
The returns come mainly from three types of page, and the mix matters for ROI:
- Category and sub-category pages capture queries such as "cotton kurta sets for women" or "non-stick tawa". These are the highest-value organic pages in ecommerce, because they match commercial intent across a whole range and they compete less directly with Shopping ads than single-product queries do. This is where most of the model's revenue comes from.
- Product pages capture exact product and attribute searches. They convert well, but on many of these queries paid Shopping listings sit above them, so their click-through share is lower.
- Comparison and buying-guide content captures earlier-stage queries, such as "best air fryer for a family of four". These convert less directly, but they are the pages AI Overviews and assistants cite, and they feed the category pages with internal links. Choosing which of these to write is a keyword strategy question before it is a content question.
The incrementality haircut
This is the adjustment almost every SEO forecast leaves out.
Not every organic order is caused by SEO. Some shoppers searched your brand name and would have found you anyway. Some clicked your organic listing instead of the Shopping ad they would otherwise have clicked, so paid simply lost an order it would have won. GA4 books all of that as organic revenue.
The model applies a 25 percent incrementality haircut: only 75 percent of attributed organic revenue counts as profit SEO created. That single assumption moves organic payback from month 13 to month 16. If your forecast does not include a haircut like this, it is the flattering version.
The 24-Month Model
Here is the full comparison for the model store, both channels measured in contribution profit after every cost.
Assumptions, stated plainly:
- Store: ₹1,500 average order value, 40 percent contribution margin, ₹600 contribution per order.
- Paid track: ₹3,00,000 media plus ₹36,000 fee a month, 3.2x platform ROAS, flat for 24 months. No scaling, so no diminishing returns.
- Organic track: ₹1,20,000 a month, plus ₹2,50,000 once in month one. Attributed organic revenue ramps on an S-curve from zero to ₹17 lakh a month by month 24. Only 75 percent of it counts as incremental.
- Both tracks: first-order contribution only. Repeat purchases are excluded from both, which is discussed below.
| Month | Organic revenue (attributed) | Organic monthly profit | Organic cumulative profit | Paid cumulative profit |
|---|---|---|---|---|
| 1 | ₹0 | Minus ₹3,70,000 | Minus ₹3,70,000 | ₹48,000 |
| 3 | ₹30,000 | Minus ₹1,11,000 | Minus ₹5,98,000 | ₹1,44,000 |
| 6 | ₹2,00,000 | Minus ₹60,000 | Minus ₹8,38,000 | ₹2,88,000 |
| 8 | ₹3,90,000 | Minus ₹3,000 | Minus ₹8,74,000 | ₹3,84,000 |
| 9 | ₹5,00,000 | ₹30,000 | Minus ₹8,44,000 | ₹4,32,000 |
| 12 | ₹8,00,000 | ₹1,20,000 | Minus ₹5,68,000 | ₹5,76,000 |
| 15 | ₹11,00,000 | ₹2,10,000 | Minus ₹28,000 | ₹7,20,000 |
| 16 | ₹11,90,000 | ₹2,37,000 | ₹2,09,000 | ₹7,68,000 |
| 18 | ₹13,60,000 | ₹2,88,000 | ₹7,61,000 | ₹8,64,000 |
| 19 | ₹14,30,000 | ₹3,09,000 | ₹10,70,000 | ₹9,12,000 |
| 21 | ₹15,60,000 | ₹3,48,000 | ₹17,48,000 | ₹10,08,000 |
| 24 | ₹17,00,000 | ₹3,90,000 | ₹28,79,000 | ₹11,52,000 |
The two-year totals:
| Paid | Organic | |
|---|---|---|
| Total invested | ₹80,64,000 | ₹31,30,000 |
| Attributed revenue | ₹2,30,40,000 | ₹2,00,30,000 |
| Contribution profit | ₹11,52,000 | ₹28,79,000 |
| Lowest cumulative point | Never negative | Minus ₹8,74,000 in month 8 |
| Monthly profit in month 24 | ₹48,000 | ₹3,90,000 |
Paid delivers slightly more revenue over the two years for more than two and a half times the cost, and about 40 percent of the profit. But organic's profit only exists if the business can afford to be ₹8.7 lakh down for most of the first year, and many stores cannot.
A caveat before anyone forwards that chart: this is a model, not a case study. The paid side uses Indian ecommerce auction economics and a conventional fee. The organic ramp is a curve consistent with a well-run programme on an established domain in a mid-competition category, but it is a curve we drew, not a client's GA4 export. What transfers to your store is the method and the shape. The digits will not.
What the model deliberately leaves out
Repeat purchase. Both channels acquire customers who come back. Including repeat orders improves both sides, but it improves paid proportionally more, because paid's first-order profit is so thin. A paid-acquired customer who orders 1.6 times in a year turns a ₹48,000 monthly profit into something considerably healthier. If your repeat rate is high, paid deserves more credit than this model gives it, and you should rerun it on 12-month customer value.
Paid scaling. The paid track is held flat. In practice you would push spend until marginal ROAS approaches break-even, which adds some profit before diminishing returns kick in.
Organic decay. The model assumes the programme keeps running. Stop paying for SEO and rankings erode slowly. Stop paying for ads and revenue stops the same day.
Three Milestones, Not One
When someone tells you "SEO pays off in about nine months", ask which of these three they mean. They are seven to ten months apart, and they answer different questions.
Milestone one: monthly break-even (month 9). The first month organic contribution exceeds that month's organic cost. It answers: is the programme now making money each month? It is the milestone agencies quote, because it comes earliest.
Milestone two: full payback (month 16). The month cumulative organic profit turns positive and everything spent since month one has been recovered. It answers: has this investment paid for itself? It is the milestone a CFO means when they ask whether SEO "worked".
Milestone three: channel overtake (month 19). The month organic's cumulative profit passes what paid would have earned over the same period. It answers: was this better than spending the money on ads? This is the real opportunity-cost test, and it is the one almost nobody publishes.
A founder told "month 9" who hears "month 16" will lose confidence in a programme that is performing exactly to plan. Name all three when you present an organic investment case. The trust you gain by volunteering the later numbers is worth more than a slightly better-looking forecast.
Want this model built on your store's numbers? Your AOV, your real contribution margin, your search-term data and the actual SERPs for your categories. Our ecommerce SEO agency team builds the three-milestone model as part of scoping, including the cases where the honest answer is to keep most of the budget in paid.
Where Each Channel Wins in Ecommerce
The model is one store. These are the situations that push the answer decisively one way.
| Situation | Lean toward | Why |
|---|---|---|
| New store, new domain, no sales history | PPC first | Organic needs months to start, and you need revenue plus search-term data now |
| Launch, festive sale, clearance or seasonal range | PPC | A window of weeks has no 16-month horizon to pay back over |
| Contribution margin under 20% | SEO, if the SERP allows | Break-even ROAS above 5x makes most non-brand paid unprofitable on the first order |
| Contribution margin over 50% | Both, paid scaled harder | Paid clears break-even easily, so it can scale further before marginal ROAS bites |
| Large catalogue, hundreds of categories and attributes | SEO | Each category page is a compounding asset; paid cost scales linearly with the catalogue |
| Generic product SERPs owned by Amazon, Flipkart or Nykaa | PPC on-site, plus marketplace | Your realistic organic ceiling is low; compete where you can win, including Amazon SEO |
| High repeat-purchase product such as consumables | PPC gets more credit | Lifetime value rescues thin first-order paid profit |
| Can't fund 8 to 12 months of negative organic cash flow | PPC, with a small SEO base | The best long-term ROI is irrelevant if the business cannot survive the trough |
| Already ranking but losing clicks to Shopping ads | Both, on the same queries | Paid and organic together on one SERP can lift total clicks, as in our SERP bidding experiment |
Most of these can be read before any money is spent: your margins from the P&L, your catalogue size from the product feed, and the SERP ownership from twenty minutes of searching your own category terms.
How the Two Channels Feed Each Other
The biggest ROI gains in ecommerce do not come from picking a channel. They come from wiring the two together.
Paid search terms decide the SEO roadmap. Export ninety days of Shopping and Search terms with orders and revenue. The non-brand queries with strong conversion value are your category-page priority list, already validated with real money. This removes most of the guesswork that makes SEO programmes slow.
The Merchant Center feed is an SEO asset. Product titles, attributes, GTINs and images in your feed power Shopping ads, free product listings in Google's Shopping tab, and increasingly the product data AI experiences draw on. Optimising the feed improves paid and organic at once.
Brand bidding needs an honest test. Brand campaigns post the best ROAS in the account because they catch people already looking for you. They inflate blended paid ROAS. If no competitor or marketplace bids on your brand, pause brand bidding for a few weeks and measure how much revenue simply moves to the organic listing. If Amazon or a rival sits above you, keep it.
Winning organic pages lower paid cost. Once a category page ranks well for a query, you can reduce bids on that query and let organic carry more of it, reallocating budget to queries where you have no organic presence. This is the practical mechanism for shifting budget from paid to organic as each milestone passes.
Paid landing-page learnings improve organic conversion. Tests on paid landing pages, including the offer, layout, trust signals and checkout fixes, apply directly to the same category and product pages organic traffic lands on. A conversion-rate gain lifts both channels' ROI at once.
Common Mistakes in the Ecommerce SEO vs PPC Decision
Comparing ROAS with traffic. One is a revenue ratio and the other is a volume count. Neither is profit. Convert both to contribution profit or do not compare them.
Leaving the fee, returns and RTO out of break-even ROAS. Cash-on-delivery RTO rates in India can erase a large share of a category's margin. A break-even ROAS calculated on gross margin rather than contribution margin is the most common reason profitable-looking accounts lose money.
Quoting the earliest milestone as if it were payback. Month 9 is not month 16. Say which one you mean.
Forgetting the incrementality haircut. Branded and cannibalised organic orders make SEO look better than it is, just as brand bidding makes paid look better than it is. Adjust both.
Underfunding both channels at once. A budget that can properly fund one channel, split across two, buys too little paid data to learn from and too little organic content to reach payback. Sequence rather than split.
Starting SEO without developer time. Ecommerce SEO is unusually dependent on engineering: faceted navigation, variant URLs, pagination, schema, page speed. If the fixes sit in a queue for three months, every milestone moves three months to the right.
Ignoring attribution. Last-click GA4 reports routinely under-credit organic content that started a purchase journey later closed through a branded or remarketing click. Our guide to marketing attribution covers the models, and enhanced conversions recovers some of the paid-side signal lost to privacy changes.
How AI Search Changes Ecommerce ROI
Both sides of the model are shifting.
On the organic side, a growing share of product research starts with a question rather than a keyword: "best sunscreen for oily skin under ₹500", "which air fryer is easiest to clean". Google's AI Overviews, ChatGPT and Perplexity answer those with named product recommendations, drawing on structured product data, reviews and comparison content. Being the recommended product is becoming as valuable as ranking the page, and the inputs overlap heavily with good ecommerce SEO: clean product schema, a complete feed, genuine reviews and comparison content that answers the buying question directly. When we audited 50 D2C brands for AI visibility, most were missing from those answers entirely, which makes this an open opportunity rather than a crowded one. Answer engine optimisation covers the mechanics.
On the paid side, the auction concentrates on the transactional queries shoppers still click, which are already the most contested. Expect gradual upward pressure on the cost of the best Shopping and Search placements.
The net effect for most Indian stores is that organic's early traffic ramp gets a little slower, while its value per visitor and its share of the AI-assisted research phase rise. The milestones in this article move slightly, but the shape does not.
How to Run the ROI Breakdown for Your Store
An afternoon, a P&L, a Google Ads export and a GA4 login.
1. Calculate your real contribution margin. Start with average selling price. Subtract product cost, packaging, shipping, payment gateway fees, and the cost of returns and RTO spread across all orders. Divide what is left by the selling price.
2. Calculate break-even ROAS. One divided by that margin. Write it on the wall.
3. Rebuild paid profit, all-in. Take ninety days of revenue by campaign. Separate brand from non-brand. Multiply non-brand revenue by contribution margin, then subtract media, fees, feed tools and creative. That is your real paid profit. Compare it with what you thought it was.
4. Find your marginal ROAS. Look at what happened to ROAS the last time you raised spend meaningfully. If the extra spend returned below break-even, you are already past the profitable ceiling.
5. Price the organic side honestly. Retainer, content, tools, and the internal developer days the technical fixes will need, at loaded cost. Check which technical issues you actually have with a proper SEO audit before estimating developer time.
6. Draw a conservative organic ramp. Base it on your non-brand paid search terms: the queries you already know convert, the category pages you would need to build or fix, and realistic click shares given who owns the SERP. Then apply an incrementality haircut of at least 25 percent.
7. Find all three milestones. Compute month-by-month organic profit, cumulative profit and paid's cumulative profit. Mark monthly break-even, payback and overtake. Then check whether the business can fund the trough.
Pre-decision checklist
- Contribution margin calculated after returns and RTO, not gross margin
- Break-even ROAS known for every major product category
- Brand and non-brand paid revenue separated
- Management fee, feed tools and creative included in paid cost
- Marginal ROAS checked at current spend
- SERPs checked for marketplace and Shopping-ad dominance on top category terms
- Developer time for technical SEO committed in writing
- Organic forecast built from real converting search terms
- Incrementality haircut applied to organic revenue
- All three milestones named, and the trough funded
The KPIs That Actually Measure Channel ROI
| KPI | Channel | What it tells you | Watch out for |
|---|---|---|---|
| Contribution profit | Both | The only like-for-like comparison | Needs clean margin data by product |
| POAS | Paid | Profit per rupee of ad cost | Should include fees, not just media |
| Marginal ROAS | Paid | Whether the next rupee is profitable | Only visible when spend changes |
| Non-brand revenue share | Both | How much growth is new demand rather than existing customers | Brand traffic flatters both channels |
| Non-brand organic revenue | SEO | Organic's incremental contribution | GA4 channel groupings blur brand queries |
| Category page rankings and clicks | SEO | Whether the highest-value pages are working | Rankings without clicks under Shopping ads |
| Blended MER | Both | Total revenue divided by total marketing cost | Hides which channel is doing the work |
| 12-month customer value by channel | Both | Whether repeat purchase changes the verdict | Needs at least a year of cohort data |
| Monthly and cumulative organic profit | SEO | Progress toward the three milestones | Month-to-month noise; judge on quarters |
If your reporting stops at ROAS and sessions, it cannot answer the ecommerce SEO vs PPC question at all. Our guide to reducing customer acquisition cost goes further into the cohort side.
Frequently Asked Questions
Is SEO or PPC better for an ecommerce store? Neither in general. PPC produces orders within days and suits new stores, launches and seasonal pushes. SEO takes four to eight months to produce meaningful orders but its cost does not rise with volume, so for a store with a catalogue worth ranking and a contribution margin above about 30 percent it becomes the more profitable channel over two years. In the model here, paid returned about ₹11.5 lakh of profit and organic about ₹28.8 lakh, after a trough of ₹8.7 lakh.
What is break-even ROAS and how do I calculate it? It is the ROAS at which an order exactly covers its own ad cost. Divide 1 by your contribution margin, meaning what is left after product cost, shipping, packaging, gateway fees and returns. A 40 percent margin needs 2.5x, 25 percent needs 4.0x, and 15 percent needs about 6.7x.
What is the difference between ROAS and ROI in ecommerce? ROAS divides revenue by ad spend and ignores every other cost. ROI divides profit by total investment. A 3.2x ROAS campaign can have a thin or negative ROI once product cost, fulfilment, returns and fees are counted, and ROAS cannot describe SEO at all because SEO has no ad spend.
What is a good ROAS for ecommerce in India? Anything comfortably above your break-even ROAS. The widely quoted 3x to 4x target is profitable for beauty and supplements, roughly break-even for fashion after returns, and loss-making for electronics.
How long does ecommerce SEO take to pay for itself? In the model, organic breaks even month-on-month in month 9, recovers its full cost in month 16 and overtakes paid's cumulative profit in month 19. Established domains with large catalogues and fast developer turnaround get there sooner; new domains in marketplace-dominated categories may not get there.
Why does organic revenue in GA4 look higher than it really is? Because it includes branded searches and shoppers who would have clicked a paid listing instead. Apply an incrementality haircut, 25 percent in this model, and measure your own figure by segmenting branded organic traffic and testing brand-bid pauses.
Should an ecommerce store bid on its own brand name? Only when competitors or marketplaces bid on it. Otherwise brand campaigns mostly capture shoppers already looking for you, inflating paid ROAS. Test a pause and measure how much revenue moves to organic.
Do Google Shopping ads take traffic from organic results? On transactional product queries, yes, because they sit above organic listings. That is why Shopping ads suit product-level queries and SEO usually earns more on category, comparison and buying-guide queries.
Is PPC or SEO better for a low-margin ecommerce business? Low margins punish paid more, because a 15 percent margin needs 6.7x ROAS just to break even. SEO has no per-order media cost. But low-margin categories are often dominated by marketplaces in organic results, so check the SERP first.
How do AI shopping answers change the decision? They reward stores with clean product schema, complete feeds, genuine reviews and comparison content, which are the same foundations as good ecommerce SEO. That shifts part of organic's value from ranking pages to being the product an AI assistant recommends.
Where to Go From Here
If you want the three-milestone model built on your store's real margins, search terms and SERPs, that is a scoping conversation, not a sales pitch. Tell us what you sell and what you spend now, and we will show you where your break-even ROAS sits, which paid campaigns are below it, and how long an organic programme would realistically take to pay back.
If you already know where the budget is going, our ecommerce SEO agency and ecommerce PPC services pages set out what each programme involves. For Shopify stores specifically, see Shopify SEO services. D2C founders will find the full-funnel view on our D2C marketing page, and Google Ads management and Meta ads cover the paid side platform by platform.
Related Reading on Ecommerce Channel ROI
- PPC vs SEO Cost: The Real Numbers for India - the lead-generation version of this comparison
- SEO vs PPC: Which to Invest In First - the sequencing decision across business types
- Google Ads Cost in India: CPC Benchmarks - why ecommerce clicks are the cheapest in the auction
- When Performance Max Works for Ecommerce - the paid campaign type most stores misjudge
- Google Shopping India - setting up the feed both channels rely on
- Ecommerce SEO Checklist - the technical and on-page work behind the organic ramp
- Faceted Navigation SEO - the most common ecommerce technical blocker
- The Ecommerce SERP Squeeze - why a first-place ranking can still sit below the fold
- How to Choose an Amazon SEO and PPC Agency - when the marketplace is the better battlefield
- How Long Does SEO Take? - the ramp curve behind the organic model
- Performance Marketing Metrics That Connect to Revenue - ROAS, CAC and the metrics around them

Aditya Kathotia
Founder & CEO
CEO of Nico Digital and founder of Digital Polo, Aditya Kathotia is a trailblazer in digital marketing. He's powered 500+ brands through transformative strategies, enabling clients worldwide to grow revenue exponentially. Aditya's work has been featured on Entrepreneur, Economic Times, Hubspot, Business.com, Clutch, and more.