

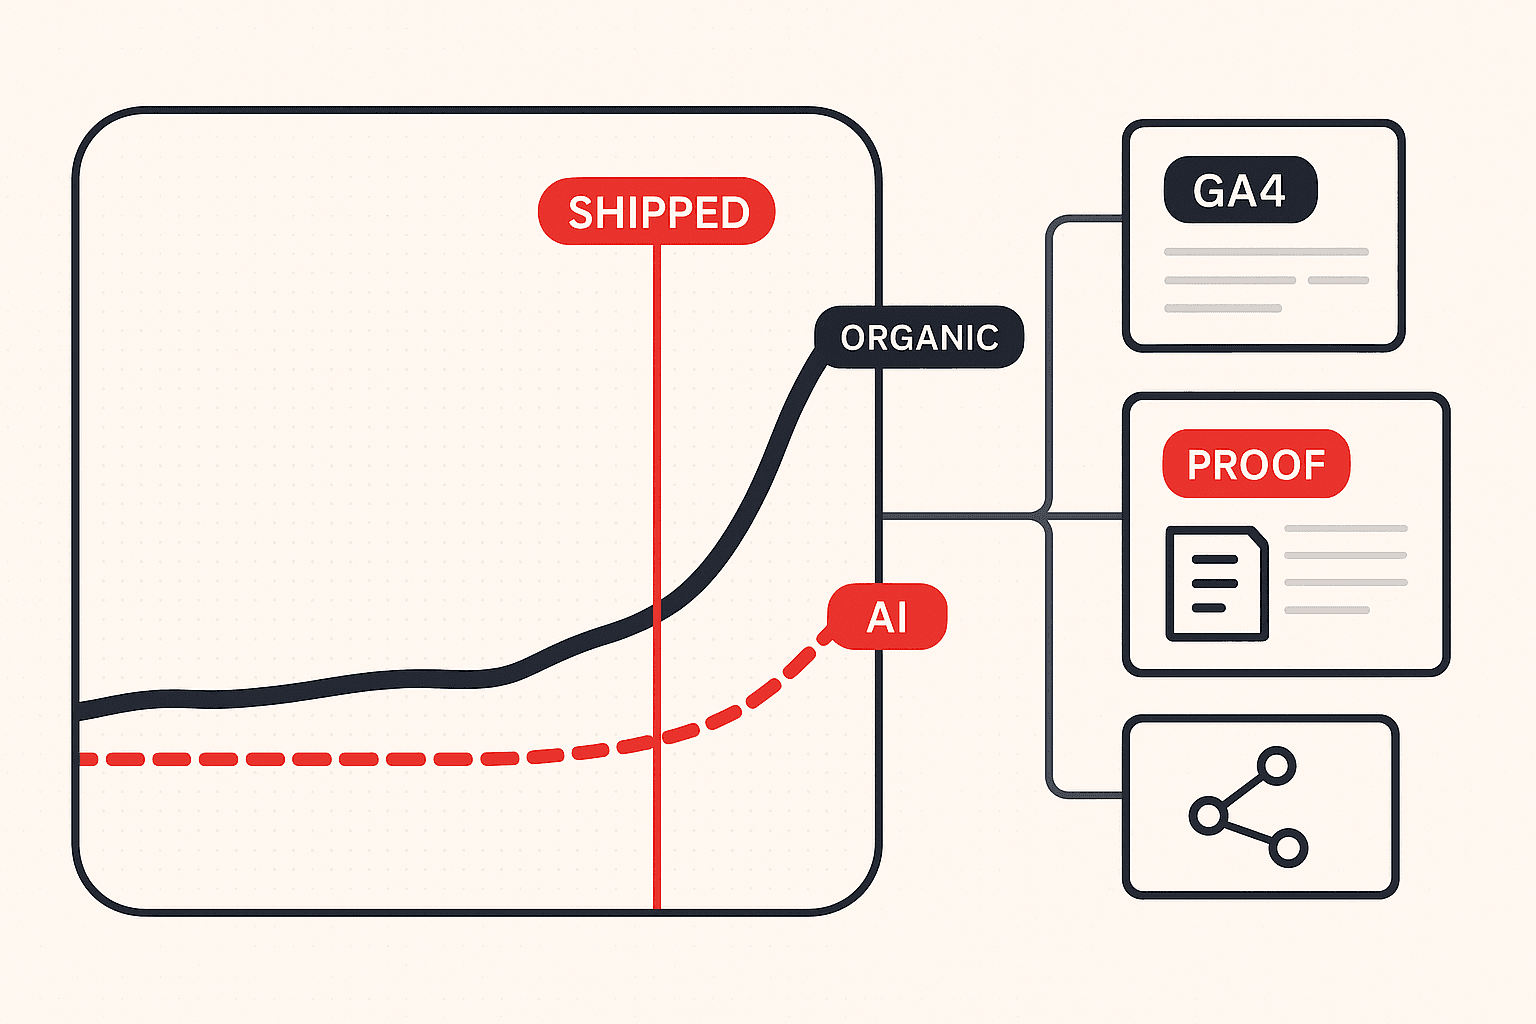
In the first week of May 2026 we shipped a full answer engine optimisation programme on our own website. Twelve new pages, entity and author schema wired through roughly 110 existing articles and case studies, extractable answer blocks on every pillar, an llms.txt implementation, IndexNow, and a round of redirect and cannibalisation cleanup.
Then we waited, and we watched the numbers.
This post is what the numbers said. It is our own Google Analytics 4 property and our own Search Console data, pulled through the APIs rather than screenshotted from a dashboard, covering 1 August 2025 to 27 August 2026. Every figure below is queryable. Where the data is thin or ambiguous we say so, because the interesting parts of this dataset are the parts that contradict the marketing narrative around AI search.
The headline is not that AI search optimisation worked. It is that it worked on a channel almost nobody is reporting on correctly, while delivering most of its measurable value somewhere else entirely.
The Short Answer
AI assistant referral sessions grew 3.9x, from an average of 67 per month to 259 per month. Google organic sessions grew 3.0x over the same period, from 737 per month to 2,224 per month. Because organic was nine times larger to begin with, it contributed 1,487 additional sessions per month against 192 from AI assistants: classic organic search delivered 7.8 times more absolute traffic than the AI channel the work was ostensibly aimed at.
The AI channel's share of total sessions moved from 3.2 percent to 4.6 percent. That is real growth and a modest share shift, not a transfer of the internet.
What changed more than volume was quality. AI referral engagement rate went from 25.7 percent to 48.8 percent, and AI-referred sessions fired a lead event at roughly six times the rate of organic search sessions. The traffic is small, better qualified than anything except paid search, and mostly invisible in GA4's default reports.
What We Actually Shipped, and When
Attribution is only honest if the intervention is specific. Ours was concentrated in a single week, 6 to 8 May 2026, with a smaller preparatory batch in late April. In rough order of expected impact:
| Change | What it was | Layer it targets |
|---|---|---|
| Entity and author schema | A single Person entity with a full sameAs chain, wired into ~80 blog Article schemas, 28 case studies and the about page | AI + classic |
| Case study schema | Article plus a client Organization entity, BreadcrumbList and FAQPage across all 28 case studies | AI + classic |
| Extractable answer blocks | A short, self-contained answer block at the top of every service pillar | AI |
| Twelve new pages | Four AI-search pillars, three reference pages, four service pillars, one person hub | AI + classic |
| FAQ expansion | Pillar FAQ sets taken from four entries to twelve, with synced FAQPage schema | AI + classic |
| llms.txt and llms-full.txt | Auto-generated route handlers plus an AI content declaration in the document head | AI |
| IndexNow | Bing and Yandex ping integration on deploy | Classic |
| Redirects and consolidation | 17 redirects resolving legacy URLs, slug renames and keyword cannibalisation | Classic |
| Internal linking | A per-category contextual sidebar on every blog post, plus service and pillar cross-links | Classic |
Read that table honestly and the central limitation of this study is obvious: we changed AI-facing things and classic-SEO things in the same week. There is no clean control. Twelve new well-built pages and a redirect cleanup would have lifted organic search whether or not a single AI engine ever crawled the site.
We are not going to pretend otherwise, and you should be sceptical of any agency case study that does. What this dataset can tell you is the shape and size of the outcome. What it cannot tell you is the precise share of that outcome caused by the AI-specific work. If you want the mechanics of the individual changes rather than the results, we documented the content side in how we rebuilt a blog to answer the questions LLMs ask and the entity work in entity SEO and the knowledge graph.
How We Measured It
Property and window. One GA4 property covering nicodigital.com, queried through the Data API. Search Console data comes from the sc-domain:nicodigital.com property through the Search Analytics API. Window is 1 August 2025 to 27 August 2026.
Periods. Baseline is 1 August 2025 to 31 March 2026, eight complete months. April 2026 is excluded as a transition month because preparatory work began in late April and the month is visibly mid-transition in every series. The post-intervention period is 1 May to 31 July 2026, three complete months. August 2026 is partial at the time of writing and is shown in charts but excluded from period averages.
AI source definition. We match sessionSource against an explicit list: chatgpt.com, perplexity.ai, perplexity, gemini.google.com, claude.ai, copilot.com, notebooklm.google.com, copilot.microsoft.com. We deliberately did not use GA4's default AI Assistant channel group, for reasons that turned into one of the more useful findings below.
Three caveats we want in front of the data rather than buried under it:
copilot.comis ambiguous. It may be Microsoft Copilot or it may be the unrelated client-portal SaaS at the same domain. It is 17 sessions across 13 months, so it does not move any conclusion either way, but we have left it in and flagged it rather than quietly dropping it.- GA4 returns slightly different totals depending on how a query is cut. Summing months gives 776 AI sessions for May to July; a single aggregate query over the same range gives 778. That 0.3 percent variance is normal session-boundary behaviour, not an error, and we have noted where the two numbers appear.
- 169 AI sessions, 10.7 percent of the total, have no resolvable landing page, an average duration of seven seconds and a 3 percent engagement rate. That is almost certainly link prefetch or bot activity rather than humans. Our real human AI traffic is probably around a tenth lower than the headline count.
Finding 1: AI Referral Traffic Grew 3.9x, and It Is Still Small
The monthly series, in full:
| Month | AI referral sessions | Google organic sessions | GSC clicks | GSC avg position |
|---|---|---|---|---|
| Aug 2025 | 70 | 853 | 509 | 50.6 |
| Sep 2025 | 116 | 775 | 662 | 45.0 |
| Oct 2025 | 53 | 648 | 567 | 29.9 |
| Nov 2025 | 68 | 674 | 656 | 24.5 |
| Dec 2025 | 49 | 764 | 614 | 30.4 |
| Jan 2026 | 55 | 772 | 682 | 28.4 |
| Feb 2026 | 74 | 750 | 660 | 24.7 |
| Mar 2026 | 51 | 662 | 593 | 20.8 |
| Apr 2026 (transition) | 78 | 1,199 | 1,018 | 18.1 |
| May 2026 | 238 | 1,948 | 1,457 | 14.5 |
| Jun 2026 | 253 | 2,158 | 1,661 | 19.4 |
| Jul 2026 | 285 | 2,567 | 1,744 | 21.1 |
| Aug 2026 (partial) | 183 | 2,054 | 1,362 | 25.3 |
Search Console corroborates the GA4 story independently: clicks went from an average of 618 per month to 1,621, a 2.6x increase, while average position improved from 31.8 to 18.3 (simple mean of the monthly averages, not impression-weighted). Two separate systems, measuring different things, agreeing on the direction and rough magnitude. That is the closest thing to validation a single-site study gets.
The AI series is genuinely steep. From a 67-session monthly baseline to 259, sustained across three months and still climbing in July. If you had asked us in April to predict it, we would have guessed lower.
But look at the axis. We had to magnify the AI line five times to make it visible next to organic on the same chart. That is the finding.
Finding 2: The Bigger Winner Was Classic Organic
This is the number that should reframe most AEO business cases.
| Metric | Baseline (Aug 25 to Mar 26) | Post (May to Jul 26) | Change |
|---|---|---|---|
| AI referral sessions per month | 67.0 | 258.7 | 3.86x (+286%) |
| Google organic sessions per month | 737.3 | 2,224.3 | 3.02x (+202%) |
| GSC clicks per month | 617.9 | 1,620.7 | 2.62x (+162%) |
| AI absolute gain per month | - | +191.7 sessions | - |
| Organic absolute gain per month | - | +1,487.0 sessions | - |
| AI as a share of organic volume | 9.1% | 11.6% | +2.5 pts |
| AI as a share of all sessions | 3.2% | 4.6% | +1.4 pts |
The AI channel grew faster in percentage terms. Organic grew 7.8 times more in sessions. If you funded this programme on a forecast of AI referral traffic, you would have missed almost 89 percent of the traffic it actually produced.
The thesis of this post, stated plainly. AEO is not a separate channel with a separate business case. It is SEO with a wider reporting surface. Entity clarity, complete schema, extractable answers, consolidated information architecture and documented proof are the requirements for being cited by an AI engine. They are also, more or less exactly, the requirements for ranking well in 2026. Budget the work once and report it on both surfaces.
We should be careful about how strongly we claim this, because of the confounding described earlier. Twelve new pages and a redirect cleanup are classic SEO moves and they landed in the same week. A stricter experiment would have staggered them. Ours did not, because we were running a website, not a laboratory.
What we can say with confidence is the negative claim, and it is the useful one: nothing in this dataset supports funding an AEO programme on projected AI referral traffic alone. At our scale the channel added under 200 sessions a month. If your board approves budget on that basis and the AI channel underdelivers, you lose the programme, including the 89 percent of value that showed up elsewhere. Frame it correctly at the start. We wrote more about which client profiles justify this spend in which clients are worth a GEO strategy, and about the production economics in the cost of producing AEO content at scale.
Finding 3: GA4's Default Report Hides 61% of Your AI Traffic
This is the most immediately actionable thing in the dataset, and it applies to your property whether or not you ever run an AEO programme.
GA4 now ships an AI Assistant default channel group. On our property it is badly incomplete.
| Period | AI sessions found by querying sessionSource | Sessions in GA4's AI Assistant channel | Captured |
|---|---|---|---|
| Aug 2025 to May 2026 | 852 | 0 | 0% |
| Jun 2026 | 253 | 151 | 59.7% |
| Jul 2026 | 285 | 279 | 97.9% |
| Aug 2026 (partial) | 183 | 176 | 96.2% |
| Full window | 1,573 | 606 | 38.5% |
Read that table carefully, because the failure is more specific than "GA4 undercounts." Once the channel group is properly live it is accurate: it captured 97.9 percent of source-level AI sessions in July and 96.2 percent in August. June, its activation month, was a partial 59.7 percent. The problem is everything before that. The channel group has no backfill at all. Ten months of AI referral history, 852 sessions, does not exist in the default report and never will.
The practical consequence is not a slightly low number. It is a fabricated shape. A marketing team opening the standard Traffic Acquisition report today sees an AI Assistant line that begins at zero in June 2026 and climbs, which reads as a channel that appeared this summer. On our site AI assistants have been sending traffic steadily since at least August 2025, and the honest baseline for judging any AEO programme sits entirely inside the invisible period.
The residual gap once the channel is live comes from sources GA4 does not confidently classify: bare perplexity with no domain, notebooklm.google.com, and the ambiguous copilot.com. Small, but they are exactly the emerging engines you would want an early read on.
Fix it like this. In GA4, build a custom channel group with a condition matching sessionSource against an explicit list, and review that list monthly as new assistants appear:
chatgpt.com
perplexity.ai
perplexity
gemini.google.com
claude.ai
copilot.microsoft.com
notebooklm.google.com
you.com
Then report AI referrals as their own line rather than letting them dissolve into Referral, and benchmark them against Organic Search rather than against total site traffic, because comparing a 4 percent channel to a whole-site average tells you nothing. If you want the broader set of GA4 reports most teams never configure, we covered them in the Google Analytics insights you are missing and internal site search as a GA4 goldmine.
One more thing to configure while you are in there: treat any AI session with a landing page of (not set) as suspect. Ours were 10.7 percent of the total, averaged seven seconds and engaged at 3 percent. Segment them out before you report a number to anyone.
Finding 4: The Engine Mix Shifted Hard
Aggregate AI traffic hides a significant reshuffle underneath it.
| Engine | Baseline (8 months) | Baseline share | Post (3 months) | Post share | Monthly change |
|---|---|---|---|---|---|
| ChatGPT | 290 | 54.1% | 516 | 66.3% | 36.3 to 172.0/mo (4.7x) |
| Gemini | 36 | 6.7% | 103 | 13.2% | 4.5 to 34.3/mo (7.6x) |
| Perplexity | 179 | 33.4% | 80 | 10.3% | 22.4 to 26.7/mo (1.2x) |
| Claude | 29 | 5.4% | 61 | 7.8% | 3.6 to 20.3/mo (5.6x) |
| Copilot (ambiguous) | 1 | 0.2% | 14 | 1.8% | 0.1 to 4.7/mo |
| NotebookLM | 1 | 0.2% | 4 | 0.5% | 0.1 to 1.3/mo |
| Total | 536 | 100% | 778 | 100% | 67.0 to 259.3/mo |
Three things worth pulling out.
ChatGPT consolidated. It was already the leader and it extended, from 54.1 percent of AI referrals to 66.3 percent. If you are prioritising one engine, the arithmetic is not close. We wrote the tactical version of this up separately in how to rank on ChatGPT.
Gemini was the fastest mover by a distance. A 7.6x increase in monthly sessions, from a base so small it was easy to ignore. Given Gemini's distribution inside Google's own surfaces, we expect this line to keep steepening and we now track it as a first-class engine rather than a rounding error.
Perplexity flatlined and its share collapsed. Absolute monthly sessions barely moved, 22.4 to 26.7, while its share fell from 33.4 percent to 10.3 percent. It did not decline; it simply failed to participate in the growth. Perplexity also sends our least engaged AI traffic, at a 29.2 percent engagement rate against 51.7 percent for ChatGPT and 51.5 percent for Gemini. That is a real strategic input: Perplexity is the engine most often optimised for in AEO content, and on our data it is the one delivering the least. Our tactical notes on it are in how to rank on Perplexity, which we will be revising in light of this.
Microsoft Copilot is effectively absent. Exactly one session from copilot.microsoft.com in 13 months, while Bing organic sent 669 over the same window. Whatever Copilot is doing with Bing's index, it is not sending us referral traffic.
Finding 5: Quality Changed More Than Volume
The engagement shift is proportionally larger than the traffic shift, and it is the part we did not anticipate.
| Metric | AI referrals, baseline | AI referrals, post | Google organic, post |
|---|---|---|---|
| Engagement rate | 25.7% | 48.8% | 52.0% |
| Average session duration | 145.8s | 207.2s | 168.8s |
| Pages per session | 1.41 | 1.33 | 1.40 |
| New visitors (of resolved) | - | 75.7% | - |
| Desktop share | - | 85.0% | 78.5% site-wide |
Engagement rate nearly doubled. Before the programme, three quarters of AI-referred sessions bounced without meaningful interaction. After it, roughly half engaged. Average session duration rose 42 percent, and post-programme AI visitors now stay 23 percent longer than organic visitors do.
The pages-per-session number is the interesting counterweight: it went slightly down, to 1.33, below organic's 1.40. AI-referred visitors are not browsing. They arrive on one page, read it properly for three and a half minutes, and leave. They have been sent to a specific answer and they consume that answer.
That has a direct implication for page design. A visitor who will only ever see one page needs that page to carry the full argument, the proof, and the next step. Multi-page nurture journeys do not exist for this audience. It also means the standard bounce-rate anxiety is misplaced here; a single-page session lasting 207 seconds is a good outcome, not a failure.
Three quarters of these visitors are new, which confirms AI assistants are functioning as a discovery surface rather than a re-entry path for people who already know the brand. And the desktop skew is real but modest, 85 percent against a 78.5 percent site-wide baseline, consistent with work-context research rather than casual mobile browsing.
Finding 6: AI Sends People to Proof, Not to Sales Pages
This was the most surprising finding in the dataset and it has changed what we prioritise.
657 of 1,573 AI referral sessions landed on a case study. That is 41.8 percent of all AI traffic pointed at one content type. Site-wide, case studies took 16.0 percent of landing sessions. AI-referred visitors were 2.6 times more likely to land on a case study than the average visitor.
The specific pages, by AI sessions:
| Case study | AI sessions | Avg duration |
|---|---|---|
| Bella Vita | 156 | 139s |
| Groww | 114 | 119s |
| Ditto Insurance | 94 | 106s |
| Country Delight | 64 | 137s |
| Case study index | 44 | 321s |
| Razorpay | 39 | 59s |
| Bajaj Finserv | 28 | 198s |
| Astrotalk | 25 | 120s |
| Nivi Loans | 24 | 150s |
Meanwhile every other page on the site outside the blog, which is dozens of service pillars, industry pages and landing pages that absorb most of our optimisation effort, took 230 sessions between them. That is 14.6 percent of AI traffic spread across the majority of the site. The homepage alone took 147, and those were the highest-quality sessions on the site at 369 seconds average duration.
The interpretation we find most plausible: when someone asks an assistant "who can do X for a brand like mine," the engine reaches for evidence it can attribute, not for a page that asserts capability. A case study contains a named client, a documented problem, a specific intervention and a measurable outcome. A service page contains claims. One of those is citable, and the models appear to know the difference.
What we changed as a result. Case studies were already carrying Article plus a client Organization entity from the May work, which is likely part of why they surfaced at all. We have now moved them up the priority list to sit alongside service pillars rather than below them: more internal links pointing into them, richer outcome data in the opening 100 words so it is extractable, and an explicit named-entity treatment of every client. If you are running an AEO programme and your case studies are an afterthought, that is probably the highest-leverage thing you can fix this quarter. The related question of which content formats get cited is covered in the content formats LLMs cite.
Finding 7: AI Visitors Convert at Roughly 6x Organic, on 11 Leads
The commercially important finding, presented with its uncertainty attached.
| Channel | Sessions | Sessions with a lead event | Lead rate | CTA click rate |
|---|---|---|---|---|
| Paid Search | 1,341 | 72 | 5.37% | 6.11% |
| AI Assistant | 606 | 11 | 1.82% | 3.96% |
| Organic Search | 16,600 | 50 | 0.30% | 0.89% |
| Direct | 20,325 | 12 | 0.06% | 1.17% |
| Referral | 2,426 | 1 | 0.04% | 0.54% |
AI-referred sessions generated leads at 1.82 percent against organic search at 0.30 percent, roughly a 6x difference, and clicked a CTA at 4.4 times the organic rate. Among unpaid channels, AI referrals are comfortably the best-qualified traffic on the site.
Now the caveat, which matters: that 1.82 percent rests on 11 leads. The 95 percent Wilson confidence interval on 11 of 606 runs from 1.02 percent to 3.22 percent. The precise multiple is not reliable and we would not defend it.
The direction, however, does survive. Organic search's interval on 50 of 16,600 is roughly 0.23 to 0.40 percent. The bottom of the AI range, 1.02 percent, is still more than 2.5 times the top of the organic range. The intervals do not overlap, so "AI-referred visitors convert better than organic visitors" is a defensible claim from this data even though "AI-referred visitors convert 6x better" is not yet.
We will re-run this at 50 leads and report whatever it says, including if it deflates. That is also roughly the sample at which we would advise a client to act on their own version of this number rather than treat it as a curiosity. The measurement discipline behind it is the same one we described in tracking AI citations for 90 days and how to measure brand mentions in ChatGPT and Perplexity.
One geographic note that shapes how you should read the conversion figure: roughly 80 percent of our AI referral traffic is from India, with the United States at about 4 percent. Our commercial mix is India-weighted, so the intent quality above reflects an India-heavy audience arriving at an India-focused agency. Your own split will differ and the lead rate will move with it.
What We Would Do Differently
Five things, in the order we regret them.
1. Stagger the changes. Shipping AEO work and classic SEO work in the same week made the result unattributable at the component level. If we ran it again we would ship schema and entity work first, wait four weeks, then ship new pages, then ship the redirect cleanup. Slower, but we would know which lever did what.
2. Configure AI traffic tracking before, not after. We built the source-level AI segment in August 2026 to write this post. Had it existed in August 2025 we would have had a clean, pre-configured baseline instead of reconstructing one from sessionSource after the fact.
3. Instrument case studies as conversion pages. We found out they were the primary AI landing surface eight months in. They were built as credibility assets with light CTAs. At 657 sessions and a 41.8 percent share they should have had proper conversion paths from day one.
4. Separate the prefetch traffic at source. 10.7 percent of AI sessions with no landing page and a seven-second average has been quietly inflating every AI number we looked at all year. A filter would have cost twenty minutes.
5. Track Gemini earlier. At 36 sessions across eight months it was easy to file as noise. It turned out to be the fastest-growing engine on the list, and we did not start watching it properly until it was already at 34 sessions a month.
How to Run This on Your Own Property
The whole study is reproducible in an afternoon. The sequence:
- Define your AI source list and build it as a GA4 custom channel group, using the list in Finding 3. Do not use the default AI Assistant channel as your only view.
- Pull 12 months of monthly sessions split by that AI group and by Google organic, through the GA4 Data API rather than the UI, so the numbers are reproducible and you have a file to diff against next quarter.
- Mark your intervention date honestly, including anything that landed in the two weeks either side of it. Exclude the transition month from period averages.
- Pull Search Console clicks, impressions and average position for the same months as an independent corroborating series. If GA4 and GSC disagree on direction, trust neither until you find out why.
- Segment landing pages for the AI group and compare the content-type mix against your site average. This is where the surprises live.
- Compare engagement rate, session duration and pages per session for AI versus organic across both periods, not just the latest one. The quality shift is often larger than the volume shift.
- Report lead rate with a confidence interval. If you have fewer than 30 conversions in the segment, publish the interval alongside the point estimate or do not publish the point estimate at all.
- Re-run monthly. The engine mix moved substantially in three months on our data. Anything you conclude today about Perplexity or Gemini has a short shelf life.
If you would rather have someone else build the measurement layer, that is part of what a proper SEO audit covers, and the AI-surface work sits inside AI SEO services and answer engine optimisation. The conceptual differences between the three disciplines are laid out in SEO vs AEO vs GEO, and the wider market numbers in AI search statistics 2026.
What We Are Doing Next
Four things are already in motion, and we will publish the results of each whether they work or not.
Case studies get treated as the primary AI surface. Richer entity markup, outcome data in the first 100 words, and internal links flowing into them from the service pillars rather than only out of them.
Gemini gets a dedicated workstream. At a 7.6x growth rate it has earned the same treatment ChatGPT gets. That means Google-surface-specific structured data work and closer attention to what the technical SEO layer exposes to Google's own crawlers.
Conversion paths for single-page sessions. With AI visitors at 1.33 pages per session, every page that receives AI traffic needs a self-contained conversion path. No multi-step journeys.
A 50-lead re-run of the conversion analysis. At current volumes that is roughly six to nine months away. We will report it either way, and we would rather publish a deflated number than quietly stop mentioning it. The same principle applied when we audited our own decaying content.
The larger conclusion has not changed since May. AI search is not replacing organic search on our data, and it is not a channel you can build a budget around yet. It is a second surface reading the same signals, rewarding the same underlying quality, and telling you slightly earlier than Google does whether your content is genuinely useful or merely optimised. The brands that will hold that surface in two years are the ones treating it as a reason to fix their fundamentals now rather than as a new place to put a campaign. If you are still trying to work out whether your brand is visible on that surface at all, the AI search gap is the diagnostic we would start with, and llms.txt is the cheapest first implementation.
If you want this analysis run against your own property, with your intervention dates and your engine mix, get in touch. We will show you our queries. Analysis credentials and method are on Aditya Kathotia's profile, and if you are shortlisting partners for this kind of work, how to evaluate an SEO agency in India is the buyer's guide we wrote for exactly that decision.

Aditya Kathotia
Founder & CEO
CEO of Nico Digital and founder of Digital Polo, Aditya Kathotia is a trailblazer in digital marketing. He's powered 500+ brands through transformative strategies, enabling clients worldwide to grow revenue exponentially. Aditya's work has been featured on Entrepreneur, Economic Times, Hubspot, Business.com, Clutch, and more.