

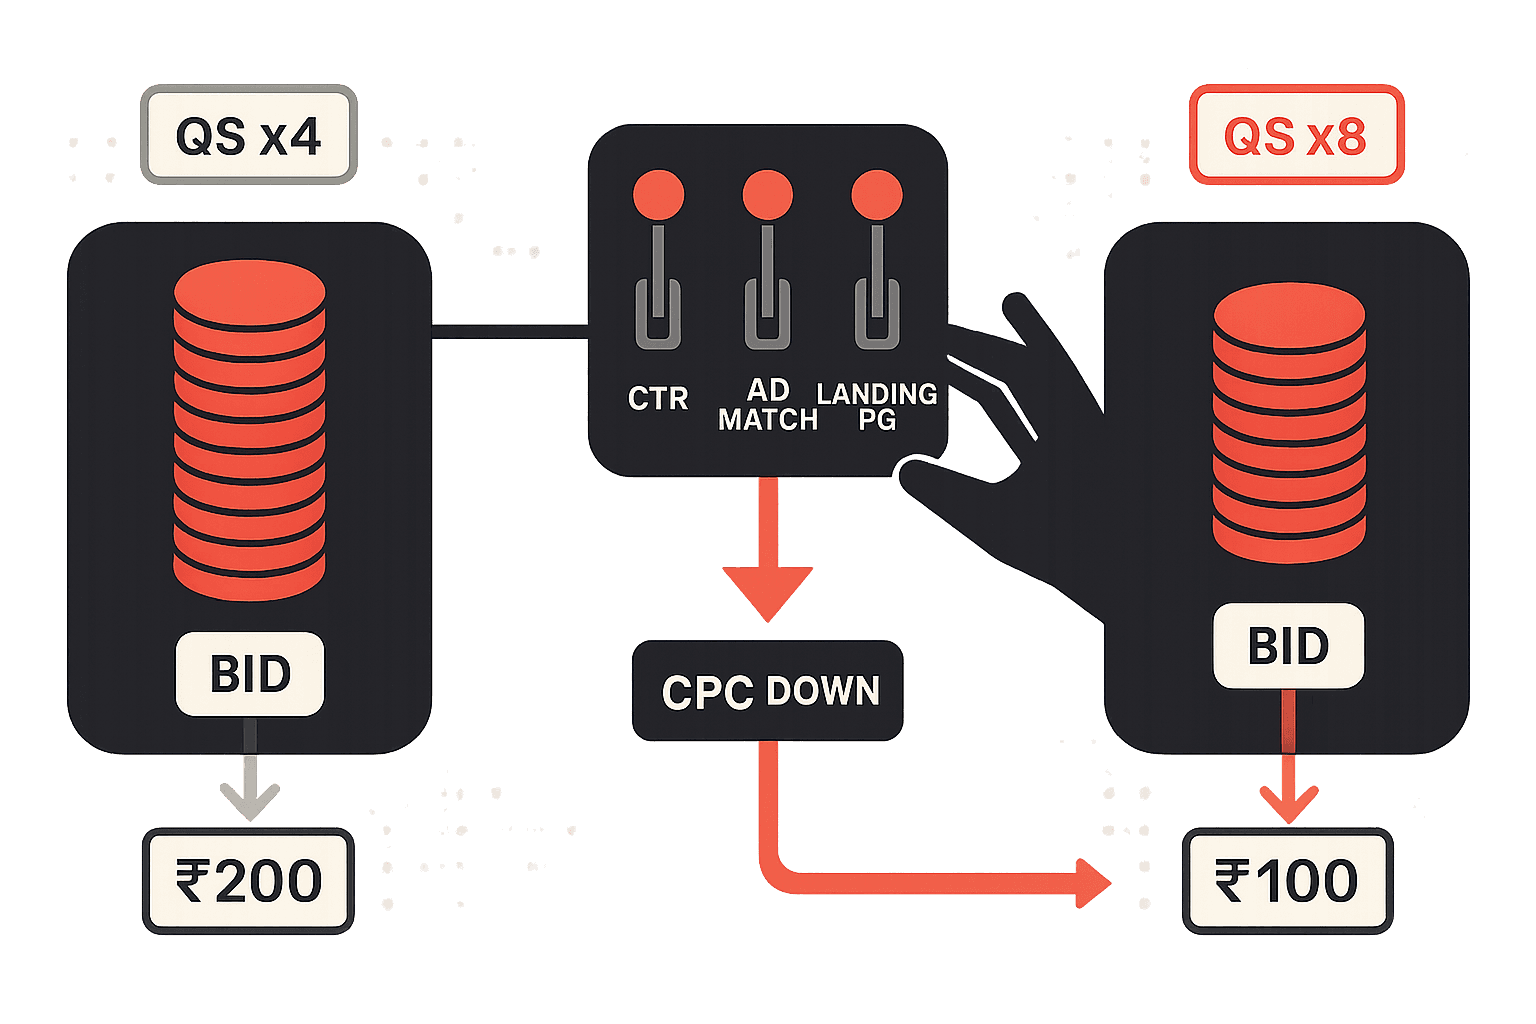
There is a single number inside Google Ads that decides how much you pay for every click. It is not your bid. It is not your budget. It is not even your conversion rate. It is Quality Score, and most accounts treat it as a passive diagnostic rather than the active lever it actually is.
Two advertisers can bid the exact same amount on the exact same keyword and pay wildly different prices for the same click. One can pay two hundred rupees per click while the other pays seventy for the identical placement. The difference is not luck and it is not a Google bias. It is Quality Score, doing what it has always done: rewarding the advertiser whose ad and landing page are predicted to be more useful to the searcher.
If your account has keywords sitting at a Quality Score of four or five, you are not just losing impression share. You are paying a relevance tax on every click. Move those keywords to an eight, hold the bid constant, and the cost per click drops thirty to forty percent in the same auction. There is nothing else in Google Ads that gives you that kind of leverage from configuration work alone. Not bid strategy. Not negative keywords. Not even ad extensions.
This is the operator's guide to understanding what Quality Score actually measures, the three components Google scores you on, and the structural moves that move a low-scoring keyword to an eight or nine without changing your bid. If you have already run a wasted-spend audit on your account and trimmed the obvious leaks, Quality Score is where the next thirty percent of efficiency lives.
Why Quality Score Is the Most Underused Lever in Google Ads
Most performance teams treat Quality Score the way a driver treats the temperature gauge: glance at it occasionally, panic if it spikes, otherwise ignore. That is exactly the wrong instinct, because Quality Score is not a warning light. It is the multiplier on every rupee you bid.
Google's Ad Rank formula is the cleanest way to see this. Ad Rank decides which ads show and in what order. It is calculated as your maximum bid multiplied by your Quality Score, then adjusted by ad extensions, search context, and Ad Rank thresholds. The actual cost per click you pay is the bid you would need to maintain your Ad Rank against the advertiser ranked just below you, divided by your Quality Score.
Two consequences fall out of that math immediately.
First, Quality Score is a force multiplier on your bid. An advertiser with a Quality Score of eight and a fifty-rupee bid has the same Ad Rank as an advertiser with a Quality Score of four and a hundred-rupee bid. Same position, half the spend.
Second, the lower your Quality Score, the more you pay to hold a position you would otherwise win for less. Every rupee you do not invest in improving relevance, you pay back to Google as a higher cost per click. It is not a punishment. It is the price of relevance you have not bothered to build.
Most accounts I audit have at least a third of their spend running through keywords with Quality Scores between three and six. Every one of those keywords is overpaying. Not by a few percent. By thirty to fifty percent. The leverage is enormous, and the work is structural, not creative. You do not need a bigger budget or smarter bidding. You need tighter ad groups, better ad copy, and landing pages that actually match the keyword.
That is the entire game.
The Three Components Google Actually Scores You On
Quality Score is reported as a single number from one to ten, but it is built from three separate ratings that Google publishes inside the keywords table: expected click-through rate, ad relevance, and landing page experience. Each is rated as Below Average, Average, or Above Average. To move Quality Score, you have to know which component is dragging the score down and attack that one specifically.
Expected click-through rate
This is the heaviest weight in the score and it predicts how likely a user is to click your ad when it appears for a given keyword, normalized for ad position. The normalization matters: Google is asking whether your ad would beat a generic competitor ad if both were shown in the same slot, not whether your ad has high raw CTR because it ran at position one for six months.
The single biggest driver of expected CTR is ad-group structure. If you have one ad group with thirty loosely related keywords sharing two responsive search ads, no human could write a single ad headline specific enough to be relevant to all of them. Google sees the same problem and rates expected CTR Below Average accordingly.
The fix is tight, intent-clustered ad groups, typically called Single Keyword Ad Groups or Single Intent Ad Groups depending on which framework you read. The principle is identical: each ad group contains only keywords that share a single, specific intent so that the ad copy can speak directly to that intent in the headline. A search for "noise cancelling headphones for office" and a search for "wireless earbuds for running" should not share an ad group, even if both sit under the same product category in your catalog. The intents are different, the ad headlines need to be different, and the expected CTR follows.
Ad relevance
Ad relevance measures how closely the keyword maps to the message of the ad copy itself, particularly the headlines. It is the most mechanically improvable component, because the keyword either appears in the ad copy and matches the intent, or it does not.
The pattern that consistently moves ad relevance from Average to Above Average is putting the most-searched keyword in the first headline of every responsive search ad, in the exact phrase a user is likely to search. Not a paraphrase, not a clever variation, not a brand-led pitch. The literal phrase. This is one of the few cases in performance marketing where being on-the-nose is the right answer.
If your ad group is tightly structured around one intent, ad relevance becomes almost automatic. If your ad groups are sprawling, no amount of clever ad copy can fix it because the keyword in the search query simply will not match what is in the ad. The two components reinforce each other.
Landing page experience
This is the component that gets ignored most often and caps the other two when it goes wrong. Landing page experience asks whether the page the click sends people to actually delivers on the promise of the ad: relevant content matching the keyword's intent, fast loading on mobile, easy to navigate, transparent about the business, and trustworthy in tone and design.
The most common failure mode is routing every campaign to the homepage. A homepage cannot be specifically relevant to every keyword, and Google's classifiers detect this immediately. The keyword "enterprise SEO audit" sent to a generic agency homepage gets a Below Average landing page experience. The same keyword sent to a dedicated SEO audit landing page with the audit offer above the fold gets Above Average. The fix is structural, not aesthetic.
Landing page speed is the second most common failure. A page that takes more than two and a half seconds to render the largest content element on mobile is consistently rated Below Average for landing page experience, no matter how good the copy is. We have covered the technical playbook for this in detail in our Core Web Vitals guide, and the same fixes that improve organic rankings also raise Quality Score on every paid keyword pointing at the same page.
How a 4-to-8 Move Actually Cuts CPC by 30-40%
The math behind the cost drop is worth seeing once, because it removes the mystery and makes it obvious why Quality Score work pays back faster than any other optimization in the account.
Take a search keyword where the typical winning bid sits at two hundred rupees. The auction is competitive, the position you want is in the top three, and the advertiser ranked just below you bids one hundred and eighty rupees with a Quality Score of seven.
If your Quality Score is three, you have to bid much more to maintain the same Ad Rank, and the actual cost per click you pay works out to roughly two hundred and ten rupees. If your Quality Score is five, the same position costs you around one hundred and forty-five rupees. At seven, the same click costs ninety-five rupees. At nine, it drops to about sixty-five.
This is not a hypothetical curve. It is a direct consequence of the Ad Rank math, observable across every account I have ever audited at scale. The exact rupee numbers vary by industry, intent, and competition, but the shape of the curve is consistent. Each step of Quality Score is roughly worth a fifteen to twenty percent reduction in actual cost per click at the same position.
Now apply that to an account spending fifteen lakh rupees a month on Google Ads where forty percent of spend runs through keywords scoring four to six. Moving the median keyword from a five to a seven cuts the cost on six lakh of monthly spend by roughly thirty percent. That is one lakh eighty thousand rupees a month, recovered without changing budget, bid strategy, or product. It is recovered by rewriting ad copy, restructuring ad groups, and pointing campaigns at intent-matched landing pages.
This is why Quality Score work is the single highest-ROI thing a paid media operator can do after a wasted-spend audit. It compounds with every other improvement. A lower cost per click means more clicks at the same budget, which means more conversions, which means a lower cost per acquisition, which means more room to scale spend profitably. The flywheel runs in your favor instead of against you.
The Four Diagnoses Behind a Low Quality Score
Almost every low Quality Score I have ever diagnosed traces to one of four root causes. The fix is structural in all four, and the work is mechanical once you know which one you are dealing with.
Diagnosis 1: Ad-group sprawl
This is the most common diagnosis by a wide margin. The ad group contains too many keywords, the keywords cover too many intents, and the ad copy cannot possibly be specifically relevant to all of them. Expected CTR drops because the ad is generic, ad relevance drops because the keyword does not appear literally in the headline, and the score collapses.
The signal is obvious once you look: ad groups with fifteen, twenty, thirty keywords across multiple intents, and Quality Scores hovering in the four-to-six range across all of them. The fix is to break the ad group into single-intent units, where each new ad group contains a tight cluster of synonyms expressing the same need. Yes, you will end up with three or four times as many ad groups. That is the point. The structural cost of more ad groups is rounding error compared to the cost of overpaying for clicks.
Diagnosis 2: Keyword-ad copy mismatch
The ad copy is well-written, the offer is compelling, but the keyword the user typed never appears in any headline. Ad relevance gets rated Average or Below Average, and expected CTR drops because users glance at the ad, do not see their search term reflected back, and click a different result.
The fix is mechanical: rewrite responsive search ads so that the highest-volume keyword in the ad group appears verbatim in headline one. Dynamic keyword insertion is a useful tool for this, particularly when an ad group covers a tight cluster of close variants. The keyword has to be in the ad. Not paraphrased. Not implied. Visible.
Diagnosis 3: Generic landing pages
Every campaign points to the homepage, or every campaign in a category points to one generic category page. Landing page experience drops to Below Average and caps Quality Score regardless of how strong the ad and keyword side are.
The fix is dedicated landing pages, one per major keyword cluster, each speaking directly to the keyword's intent within the first viewport. We have written about this extensively in our PPC landing page audit playbook, and the pattern is consistent: the page must promise what the ad promised, deliver the value proposition above the fold, present a single clear CTA, and load in under two and a half seconds on mobile.
Diagnosis 4: Poor historical CTR
Sometimes the structure looks right, the ad copy is on point, the landing page is intent-matched, but the score is still low. The cause is historical: the keyword ran for months in a poorly-structured campaign, accumulated low click-through rate, and that history is now a drag on expected CTR even though everything has been fixed.
The fix is patience and volume. Quality Score updates dynamically based on recent auctions, so a few weeks of improved CTR will move the score. If the history is particularly bad, the cleanest move is to pause the keyword in the old ad group, then add it fresh to a new, properly-structured ad group. The keyword's history is tied to its ad group context, so a clean restart often unlocks the score faster than trying to rehabilitate it in place.
A Practical 30-Day Quality Score Optimization Plan
If you are looking at an account with Quality Score scattered across the three-to-seven range and want a defensible order of operations, this is the sequence that recovers the most cost the fastest.
Week 1: Diagnose and prioritize. Export the keywords table with Quality Score and the three sub-ratings (expected CTR, ad relevance, landing page experience) for every keyword that has driven at least one hundred impressions in the last thirty days. Sort by spend. Identify the keywords with Below Average ratings on any of the three components. These are your priority list. Do not waste cycles on keywords with low spend or low search volume; the math just does not pay back fast enough.
Week 2: Restructure ad groups. Take the highest-spend, lowest-Quality-Score keywords and rebuild their ad groups around tight intent clusters. Move each keyword into a new ad group with five to ten close-variant siblings, no more. Pause the old, sprawling ad groups. Write new responsive search ads with the keyword in headline one and the keyword's specific intent reflected in the description.
Week 3: Fix landing page routing. For each new ad group, identify whether the existing landing page actually delivers on the intent. If it does not, build a dedicated landing page. The page does not need to be elaborate. It needs to deliver the promise of the ad in the first viewport, load fast, and present a single clear CTA. Use the same intent clusters you built in week two to define the landing pages, one per cluster.
Week 4: Measure and iterate. By the end of week four, the high-volume keywords will have rerated and the cost per click impact will be visible. Compare cost per click and conversion rate against the baseline. Track the right performance marketing metrics end-to-end rather than getting hypnotized by Quality Score in isolation. Identify the keywords that did not improve and diagnose why: historical CTR drag, landing page still not matched, intent still ambiguous. Iterate on those specifically.
A month of this work, properly executed, will move thirty to fifty percent of the priority keywords by at least two Quality Score points, and that translates directly to cost per click reductions in the same range. Compound that across the account and the savings are enough to fund a meaningful share of next quarter's growth experiments without raising the budget.
Where Quality Score Fits Inside the Bigger Paid Media Picture
It is tempting, once the math is clear, to treat Quality Score as the only number that matters in Google Ads. It is not. It is the leverage point on cost per click, but the overall efficiency of the account depends on multiple layers working together.
Quality Score is the auction layer. It governs how much you pay per click and how often your ad shows for a given bid. Above it sits the targeting layer: which keywords you bid on, which audiences you exclude, which match types you use. Below it sits the conversion layer: how effectively the traffic you bought turns into pipeline. A high Quality Score on a poorly-targeted keyword is still wasted money. A high Quality Score on a great keyword pointing at a bad landing page still leaks at the conversion step.
The order of operations across the three layers is consistent. Fix the targeting layer first with a wasted-spend audit that cuts the obvious leaks. Optimize the auction layer next with Quality Score work, because the leverage compounds across every keyword you keep. Then close the conversion gap with landing page optimization so the cheaper clicks you are now buying actually become customers.
Done in that sequence, the same advertising budget delivers materially more pipeline. We have seen accounts cut their effective cost per acquisition by forty to fifty percent over a single quarter using exactly this stack of moves, with no change to the underlying offer, product, or sales team. The leverage is sitting in the account structure, not in the budget.
If you are running paid media at scale and have not done a structural Quality Score pass in the last six months, this is the most disproportionate ROI work available to you. The fix is mechanical, the math is observable, and the cost recovery starts inside thirty days. Most accounts I audit have at least fifteen to twenty-five percent of total spend recoverable through this single lever.
If that sounds like your account, our team at Nico Digital has built this exact restructuring process for Google Ads accounts at every scale, from startups spending two lakh a month to enterprises spending two crore. The methodology is the same. The math always pays back. Talk to us when you are ready to stop overpaying.

Aditya Kathotia
Founder & CEO
CEO of Nico Digital and founder of Digital Polo, Aditya Kathotia is a trailblazer in digital marketing. He's powered 500+ brands through transformative strategies, enabling clients worldwide to grow revenue exponentially. Aditya's work has been featured on Entrepreneur, Economic Times, Hubspot, Business.com, Clutch, and more. Join Aditya Kathotia's orbit on LinkedIn to gain exclusive access to his treasure trove of niche-specific marketing secrets and insights.